Research note · 14 sessions
Where dashboard readers look first
Readers settle on the headline numbers within two seconds and treat the charts as confirmation, not discovery.
Annotated screen
Pins mark the four regions that participants named most often when asked what they looked at first.
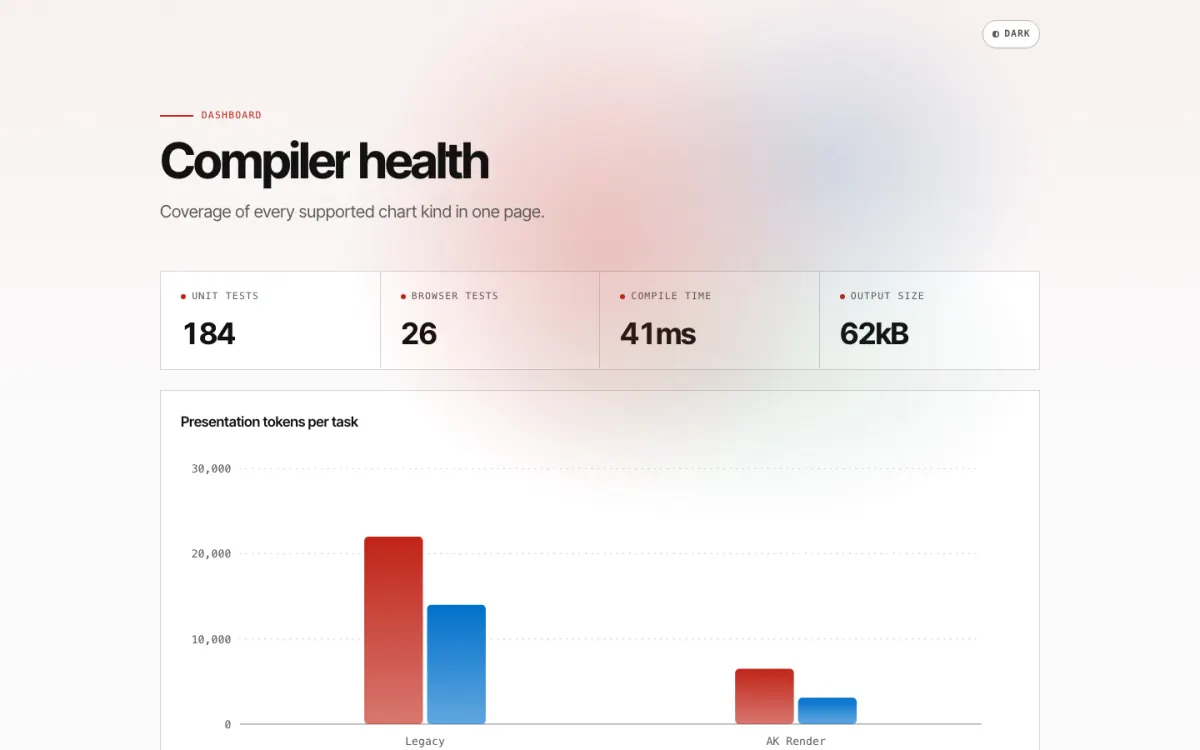
KPI row Read first by 12 of 14 participants, usually left to right.
Chart Used to confirm a number already seen in the KPI row.
Page title Skipped by most participants, who already knew which page they had opened.
Header controls Missed by half of the participants until prompted, including the date range.
Time on task
Where the first 60 seconds went
Median session opening60 s
- KPI row21 s35%
- Charts17 s28%
- Tables and lists12 s20%
- Filters and date range6 s10%
- Other4 s7%
Findings
1. Numbers before charts
Participants read the KPI values first and returned to them after every chart.
I look at the four numbers, and the chart just tells me whether to worry about them.
Participant 6, SRE
- Read KPI row first
- 12 of 14
- Returned to it
- 3.1 times
2. Badges beat columns
In tables, participants scanned for a coloured status rather than reading numeric columns.
3. Date ranges go unnoticed
Half of the participants did not notice that the page showed the last seven days.
State the range in the title
For example, "last 7 days" next to the page heading.
Repeat it in each chart caption
A reader who scrolls past the header still sees it.
Sources
F-shaped pattern of reading on the web
Information Dashboard Design
Chapter 4 on the placement of key metrics.
Session notes and coding sheet