Benchmark
v0.3 against v0.2
Same corpus, same machine, five runs each. The median of each run set is reported.
Results
v0.3 vs v0.23 improved, 1 regressed, 1 unchanged
| Metric | v0.2 | v0.3 | Change | Verdict |
|---|---|---|---|---|
| p95 compile latencylower is better | 420 ms | 310 ms | −110 ms−26.2% | improved |
| Throughputhigher is better | 1,200 pages/s | 1,480 pages/s | +280 pages/s+23.3% | improved |
| Output sizelower is better | 70.2 kB | 71.9 kB | +1.7 kB+2.4% | regressed |
| Peak memorylower is better | 48.2 MB | 48.5 MB | +0.3 MB+0.6% | unchanged |
| Cache hit ratehigher is better | 81% | 87% | +6%+7.4% | improved |
- Method
- Median of
5runs over the 11 gallery fixtures, warm process, Node 22. - Limitations
- One machine and one corpus; pages with adapter diagrams were excluded.
- Source
- Benchmark notes
Where the time goes
Compile time per phase (v0.3)
Total41 ms
- Parse and validate9 ms22%
- Normalize6 ms15%
- Render blocks14 ms34%
- Assemble CSS7 ms17%
- Verify document5 ms12%
Output budget
Budget80 kB
- Stylesheet31 kB39%
- Embedded font24.5 kB31%
- Markup12.4 kB15%
- Runtime4 kB5%
Annotated capture
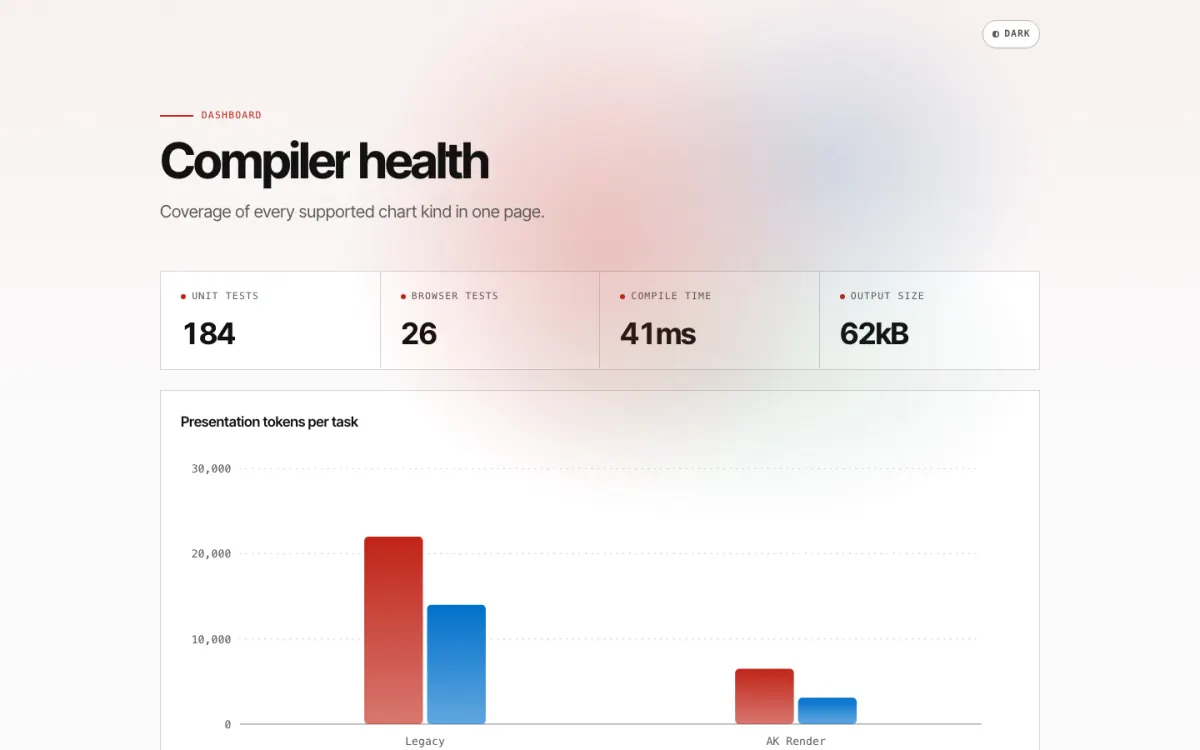
Compile time The stat counts up on arrival and settles on the authored text.
Legacy bars Each bar carries a hover value label.
AK Render bars
Theme toggle Present on every page by default.
References
Benchmark notes for v0.3
Raw timings and the machine profile.
Why p95 latency is reported rather than the mean.